Friday, 5 April 2019

Using the Lookup function to create reports on multiple DataSets

With Dynamics 365 Online, the greatest thing I miss compared to OnPremise is the relative limitation on what you can do with reports, as FetchXml is not so powerful as SQL. One option is to use the Data Export Service to get the data into a SQL database, and get the SQL queries out, but there is still a lot that can be done with FetchXml and Reporting Services. This post shows how to combine data from multiple datasets using the Lookup function.

My first rule of thumb when working out if a given SQL query can be implemented as a FetchXml query is, 'can the SQL query be written so that there is just one SELECT statement ?' If so, you've got a good chance of being to rewrite as FetchXml, but if not, you won't be able to do this in FetchXml. This test is useful, as it immediately eliminates Union queries, sub-queries and table expressions, which you can't do with FetchXml.

So, in many cases you can't do get the result that you want with one query, but Reporting Services allows you to define multiple Datasets, and hence multiple queries, in one report, and the Lookup function allows to connect the data across the Datasets.

For this post, I'll use an example I came across recently when the requirement was to get a count of records created per user, broken down by entity type. The simplified output I was looking for was:

UserLeadsOpportunities
David Jennaway2010
My Friend158

This will need to get data from the systemuser, lead and the opportunity entities. It is possible to join these in one query, but not in a way that is useful, as you end up multiplying the opportunity and lead records.

Instead, we can create separate queries. Here I'm doing one for each entity, systemuser, lead and opportunity. The systemuser query will end up as the main source for the table, with lookups to the other queries to get the respective record counts. The 3 datasets and queries are:

dsUser:
<fetch > <entity name='systemuser' > <attribute name='systemuserid' /> <attribute name='fullname' /> </entity> </fetch>

dsLead:
<fetch aggregate='true'>
    <entity name='lead' >
       <attribute name='createdby' groupby='true' alias='createdby' />
       <attribute name='leadid' alias='lead_count' aggregate='countcolumn' />
    </entity>
</fetch>

dsOpportunity:
<fetch aggregate='true'>
    <entity name='opportunity' >
       <attribute name='createdby' groupby='true' alias='createdby' />
       <attribute name='opportunityid' alias='opportunity_count' aggregate='countcolumn' />
    </entity>
</fetch>

dsLead and dsOpportunity are both simple aggregate queries to get the respective record counts for each entity by user.

Then, to create the report, I add a table based on the dsUser dataset, with the Fullname in the first column. Then for the count of leads, I can use the following Lookup expression:

=Lookup(Fields!systemuserid.Value, Fields!createdbyValue.Value, Fields!lead_count.Value, "dsLead")

Taking each of the parameters in turn:
  • Fields!systemuserid.Value - this is the Guid for the systemuserid in the dsUser dataset. This value will be compared against...
  • Fields!createdbyValue.Value - this is the Guid of the createdby in the dsLead dataset. Note that I use createdbyValue to get the Guid, as for lookup attributes the createdby will be the name
  • Fields!lead_count.Value - this is the field in the dsLead dataset that I want to display
  • "dsLead" - this is the name of the dataset that the Lookup works on
We can then do the same for the expression for the opportunity count:

=Lookup(Fields!systemuserid.Value, Fields!createdbyValue.Value, Fields!opportunity_count.Value, "dsOpportunity")

And that's it to get the basic report. As a nicety, I can add a filter for the row visibility, so that it hides rows where there is no count across any of the datasets. The Lookup function returns Nothing if no record is found, so we can use the IsNothing function.

=IsNothing(Lookup(Fields!systemuserid.Value, Fields!createdbyValue.Value, Fields!opportunity_count.Value, "dsOpportunity")) AndAlso IsNothing(Lookup(Fields!systemuserid.Value, Fields!createdbyValue.Value, Fields!lead_count.Value, "dsLead"))

We can keep adding extra datasets to count other entities, using the same approach. I don't have the patience to work out if there's a practical limit to the number of datasets we can use in one report. 

A couple of points to note:
  • You can't use the Lookup function as a calculated field, which is slightly annoying, as I think it would be neater if this were possible. I expect this is due to how Reporting Services first processes the datasets, and will then render the results
  • When testing in Visual Studio, you get prompted for credentials (or to use cached credentials)for each dataset in turn. I don't think you can do anything about this. Interestingly, it looks like Visual Studio caches the credentials per dataset, and they can be differ even if they use the same datasource. I once managed to have different datasets querying different CRM organisations, even though they were using the same datasource
I'm intending to post the full report up on GitHub in the next few days, once I've got that working properly



Sunday, 24 March 2019

Solution Layers

In Dynamics 365 Online, you may have recently noticed a new button within an unmanaged solution, 'Solution Layers'. I first saw this appear around 17th Mar 2019, and it's a welcome tool to help understand more what happens with multiple solutions in a system.


I've been playing around with this a bit in the last week, and there are a few key concepts to understand from the beginning.
  • The button is currently only visible within an unmanaged solution or the default solution. This seems to be because managed solutions are not directly editable, though I think this is a bit of an oversight, because...
  • When you click the button for a solution component, it will display any managed solutions that contain that component, along with an 'Active' solution. From what I can tell so far, I'm treating the 'Active' solution to be the same as the default solution, but there may be subtle differences
  • It makes sense that this only displays managed solutions, as these are the only one solutions that a individually layered. In contrast, unmanaged solutions are all combined into the one unmanaged layer
So, it's a little confusing to start with, in that you can only access it from the unmanaged layer, but it is displaying information about the managed layers. But, leaving that aside, what does it tell us ? It provides information at 2 levels; first the list of layers, then the detail properties that were set within that layer.
The Layers
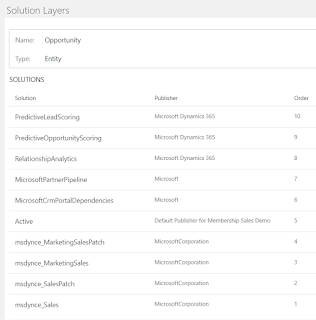
When you click on the 'Solution Layers' button, it will list all the managed solutions that contain this component, and the order in which they apply. 

Order no.1 is the first solution in which this component was imported into this organisation, with the remaining solutions in incremental order. The order listed is the order in which any changes will be applied; I think this would normally be the order in which the solutions are installed, though I suspect that Microsoft may change the order of some of their solutions, irrespective of the installation sequence. So, we start with order = 1, then any changes from each other solution are applied in turn, so that a change from a higher Ordered solution would override a change to the same property in a lower Ordered solution.

So, the information we get here is what solutions contain a component, and the order of the solutions. The interesting thing here is that some layers appear above the Active layer; from what I can tell so far, only solutions from Microsoft appear above the Active layer.
Properties within a Layer
If you click on a layer, it will then show the component properties within this layer. The 'Changed Properties' tab shows the component properties within this layer, and what value they were set to in this layer.

So, in this case we see that the msdynce_SalesPatch changes 3 properties of the Opportunity entity, for example the isauditenabled property. This indicates that the 'Include Entity Metadata' option had been selected when the entity had been added to the solution in the source system, which is one of the useful pieces of information that we can now get from the Solution Layer.

The 'All Properties' tab shows all the effective properties at this layer - i.e. taking all properties from layers at a lower order number, and applying the properties from this layer, but these can be overridden by layers with a higher number.


Note that, in the example above for the Opportunity entity, you several solutions were listed, but many don't have any changed properties. I think this is mostly because an entity will be included in a solution because one of its subcomponents (e.g. a view) has changed. To see this, you'd have to open Solution Layers on the subcomponent.

Different component types have different properties. Unfortunately the information given so far is, unsurprisingly, only the whole property. So, for example for a form, we just see the formxml and formjson, and this doesn't give us a representation of how forms are merged across solutions. However, I'm intending to dig further into whether the 'All Properties' tab can give an indication of how the formxml changes through the layers - if I find anything interesting then that could be another blog post